AP 10th Class Maths Statistics Solutions — అధ్యాయం 13 (సాంఖ్యక శాస్త్రం) లోని Exercise 13.1, 13.2, 13.3 లోని 22 ప్రశ్నలకు దశలవారీ జవాబులు. ప్రతి లెక్కకు పూర్తి పట్టిక (xi, fi, ui, cf), సూత్రంలో విలువలు వేసే విధానం, ఏ పద్ధతి ఎందుకు ఎంచుకున్నామో ఇచ్చాం. ప్రశ్నలు AP SCERT పుస్తకంలో ఉన్నట్టే ఇంగ్లీష్లో, వివరణ తెలుగులో.
పదో తరగతి గణితం Probability జవాబుల పేజీ, SA1 ముఖ్యమైన లెక్కలు రాగానే లింక్ రావాలంటే WhatsApp గ్రూప్లో చేరండి
ఈ పేజీలో: అధ్యాయంలో ఏముంది | సూత్రాలు | Exercise 13.1 | Exercise 13.2 | Exercise 13.3 | మార్కులు పోయే చోట్లు | FAQs
AP 10th Class Maths Statistics Solutions — ఈ అధ్యాయంలో ఏముంది
| ఎక్సర్సైజ్ | ఏమి కనుగొనాలి | ప్రశ్నలు |
|---|---|---|
| Exercise 13.1 | వర్గీకృత దత్తాంశం సగటు (అంకమధ్యమం, mean) | 9 |
| Exercise 13.2 | బాహుళకం (mode); కొన్నిట్లో సగటు కూడా | 6 |
| Exercise 13.3 | మధ్యగతం (median); కొన్నిట్లో సగటు, బాహుళకం కూడా | 7 |
SA1 కి ఎందుకు ముఖ్యం: Statistics అధ్యాయం SA1 గణితం సిలబస్లో ఉంది (AP SA1 Syllabus 2026-27 చూడండి). ఈ లెక్కల్లో పట్టిక, సూత్రం రెండూ ఉంటాయి; పద్ధతి ఒకసారి అలవాటైతే ప్రతి ప్రశ్నా అదే దారిలో వెళ్తుంది. ఇక్కడి 22 ప్రశ్నల పాఠం AP SCERT 10వ తరగతి గణితం Semester 2 పాఠ్యపుస్తకం నుంచే తీసుకున్నాం; జవాబులను పుస్తకం చివరి ANSWERS పేజీతో సరిచూశాం.
సగటు, బాహుళకం, మధ్యగతం సూత్రాలు
- ప్రత్యక్ష పద్ధతి: x̄ = Σfixi / Σfi. xi = తరగతి మధ్య బిందువు = (దిగువ హద్దు + ఎగువ హద్దు)/2. విలువలు చిన్నవిగా ఉన్నప్పుడు, లేదా తరగతుల పొడవులు సమానం కానప్పుడు.
- ఊహించిన సగటు పద్ధతి: x̄ = a + Σfidi / Σfi, ఇక్కడ di = xi − a. a గా మధ్యలో ఉన్న ఒక xi తీసుకోండి.
- సోపాన విచలన పద్ధతి: x̄ = a + (Σfiui / Σfi) × h, ఇక్కడ ui = (xi − a)/h. అన్ని తరగతుల పొడవు h సమానంగా ఉన్నప్పుడు ఇదే వేగం.
- బాహుళకం: l + [(f1 − f0) / (2f1 − f0 − f2)] × h. f1 = బాహుళక తరగతి (ఎక్కువ పౌనఃపున్యం) పౌనఃపున్యం, f0 = దాని ముందు తరగతిది, f2 = తర్వాత తరగతిది.
- మధ్యగతం: l + [(n/2 − cf) / f] × h. cf = మధ్యగత తరగతికి ముందు తరగతి వరకు సంచిత పౌనఃపున్యం, f = మధ్యగత తరగతి పౌనఃపున్యం.
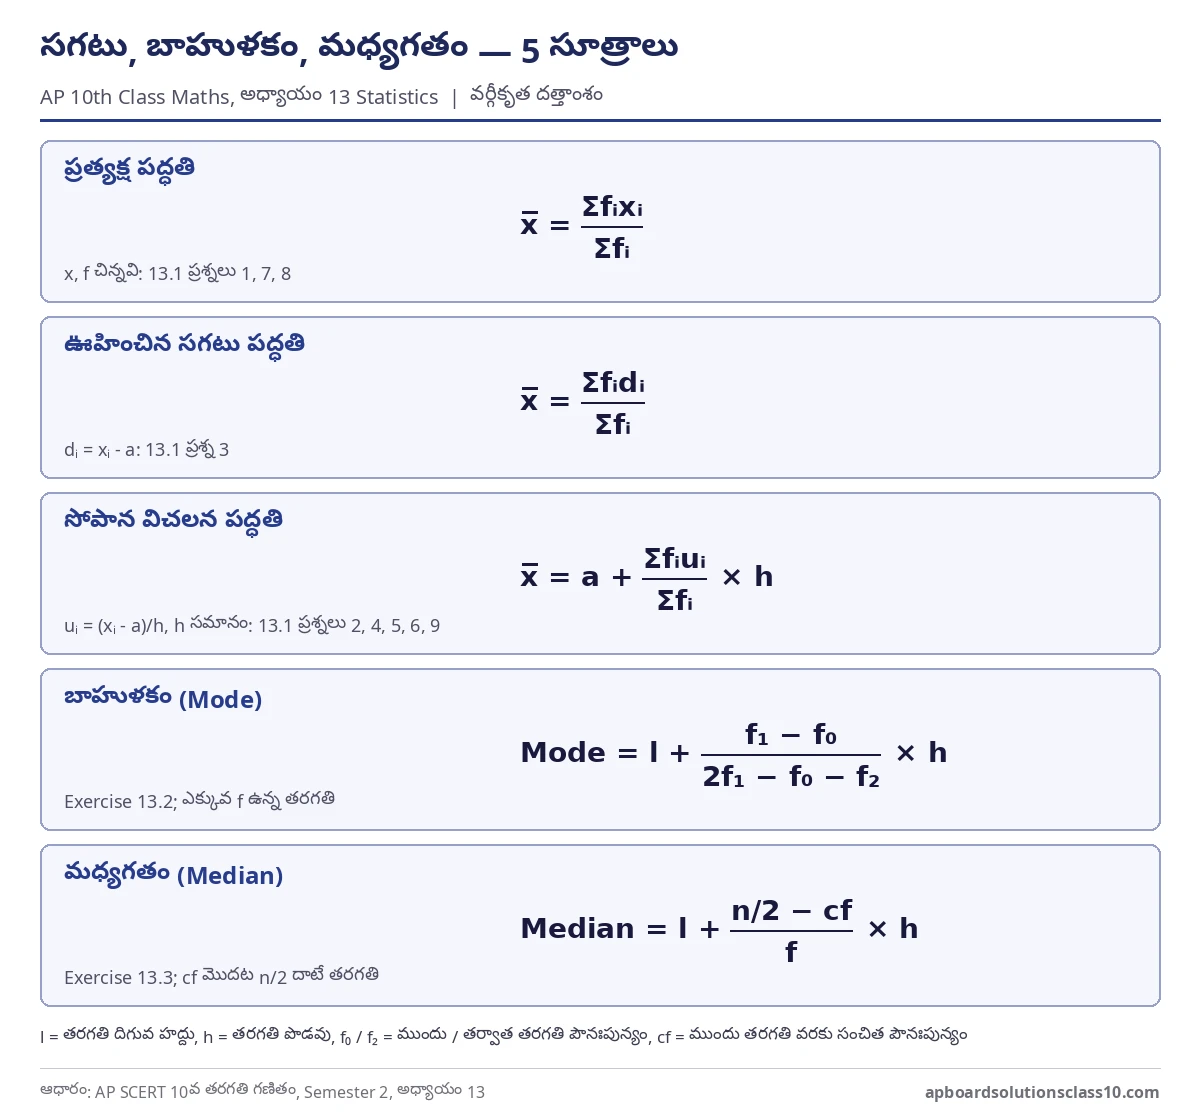
ఐదు సూత్రాలు, ఏ పద్ధతి ఏ ప్రశ్నకు — ఒకే చిత్రంలో. పరీక్ష ముందు రోజు చూసుకోవడానికి సేవ్ చేసుకోండి.
పుస్తకం చెప్పే ముఖ్య గమనిక: బాహుళకం, మధ్యగతం కనుగొనే ముందు తరగతులు నిరంతరంగా (continuous) ఉన్నాయో లేదో చూసుకోవాలి. 13.3 లో ప్రశ్న 4 ఇలాంటిదే.
AP 10th Class Maths Statistics Exercise 13.1 Solutions (Mean)
అన్ని ప్రశ్నల్లోనూ సగటే అడిగారు. ఏ పద్ధతి వాడినా జవాబు ఒకటే వస్తుంది; లెక్క సులువుగా ఉండే పద్ధతిని ఎంచుకున్నాం.
1. A survey was conducted by a group of students as a part of their environment awareness programme, in which they collected the following data regarding the number of plants in 20 houses in a locality. Find the mean number of plants per house.
| Number of plants | Number of houses |
|---|---|
| 0 – 2 | 1 |
| 2 – 4 | 2 |
| 4 – 6 | 1 |
| 6 – 8 | 5 |
| 8 – 10 | 6 |
| 10 – 12 | 2 |
| 12 – 14 | 3 |
Which method did you use for finding the mean, and why?
జవాబు చూడండి
| తరగతి | fi | xi | fixi |
|---|---|---|---|
| 0 – 2 | 1 | 1 | 1 |
| 2 – 4 | 2 | 3 | 6 |
| 4 – 6 | 1 | 5 | 5 |
| 6 – 8 | 5 | 7 | 35 |
| 8 – 10 | 6 | 9 | 54 |
| 10 – 12 | 2 | 11 | 22 |
| 12 – 14 | 3 | 13 | 39 |
| మొత్తం | 20 | 162 |
x̄ = Σfixi / Σfi = 162 / 20 = 8.1
సగటు మొక్కల సంఖ్య = 8.1 మొక్కలు
ఏ పద్ధతి, ఎందుకు: xi, fi విలువలు చిన్నవి కాబట్టి ప్రత్యక్ష పద్ధతి (direct method) వాడాం.
2. Consider the following distribution of daily wages of 50 workers of a factory.
| Daily wages (in Rs) | Number of workers |
|---|---|
| 500 – 520 | 12 |
| 520 – 540 | 14 |
| 540 – 560 | 8 |
| 560 – 580 | 6 |
| 580 – 600 | 10 |
Find the mean daily wages of the workers of the factory by using an appropriate method.
జవాబు చూడండి
xi విలువలు పెద్దవి, తరగతి పొడవు h = 20 అన్నిటికీ సమానం కాబట్టి సోపాన విచలన పద్ధతి (step deviation), a = 550.
| తరగతి | fi | xi | ui = (xi − 550)/20 | fiui |
|---|---|---|---|---|
| 500 – 520 | 12 | 510 | −2 | −24 |
| 520 – 540 | 14 | 530 | −1 | −14 |
| 540 – 560 | 8 | 550 | 0 | 0 |
| 560 – 580 | 6 | 570 | 1 | 6 |
| 580 – 600 | 10 | 590 | 2 | 20 |
| మొత్తం | 50 | −12 |
x̄ = a + (Σfiui / Σfi) × h = 550 + (−12/50) × 20 = 545.2
సగటు రోజువారీ కూలి = Rs 545.2
3. The following distribution shows the daily pocket allowance of children of a locality. The mean pocket allowance is Rs 18. Find the missing frequency f.
| Daily pocket allowance (in Rs) | Number of children |
|---|---|
| 11 – 13 | 7 |
| 13 – 15 | 6 |
| 15 – 17 | 9 |
| 17 – 19 | 13 |
| 19 – 21 | f |
| 21 – 23 | 5 |
| 23 – 25 | 4 |
జవాబు చూడండి
సగటు 18 ఇచ్చారు కాబట్టి ఊహించిన సగటు a = 18 తీసుకుంటే లెక్క సులువు. di = xi − 18.
| తరగతి | fi | xi | di | fidi |
|---|---|---|---|---|
| 11 – 13 | 7 | 12 | −6 | −42 |
| 13 – 15 | 6 | 14 | −4 | −24 |
| 15 – 17 | 9 | 16 | −2 | −18 |
| 17 – 19 | 13 | 18 | 0 | 0 |
| 19 – 21 | f | 20 | 2 | 2f |
| 21 – 23 | 5 | 22 | 4 | 20 |
| 23 – 25 | 4 | 24 | 6 | 24 |
| మొత్తం | 44 + f | 2f − 40 |
x̄ = a + Σfidi / Σfi ⇒ 18 = 18 + (2f − 40)/(44 + f) ⇒ 2f − 40 = 0
తప్పిపోయిన పౌనఃపున్యం f = 20
4. Thirty women were examined in a hospital by a doctor and the number of heartbeats per minute were recorded and summarised as follows. Find the mean heartbeats per minute for these women, choosing a suitable method.
| No. of heartbeats per minute | Number of women |
|---|---|
| 65-68 | 2 |
| 68-71 | 4 |
| 71-74 | 3 |
| 74-77 | 8 |
| 77-80 | 7 |
| 80-83 | 4 |
| 83-86 | 2 |
జవాబు చూడండి
h = 3 సమానం కాబట్టి సోపాన విచలన పద్ధతి, a = 75.5.
| తరగతి | fi | xi | ui = (xi − 75.5)/3 | fiui |
|---|---|---|---|---|
| 65 – 68 | 2 | 66.5 | −3 | −6 |
| 68 – 71 | 4 | 69.5 | −2 | −8 |
| 71 – 74 | 3 | 72.5 | −1 | −3 |
| 74 – 77 | 8 | 75.5 | 0 | 0 |
| 77 – 80 | 7 | 78.5 | 1 | 7 |
| 80 – 83 | 4 | 81.5 | 2 | 8 |
| 83 – 86 | 2 | 84.5 | 3 | 6 |
| మొత్తం | 30 | 4 |
x̄ = a + (Σfiui / Σfi) × h = 75.5 + (4/30) × 3 = 75.9
సగటు గుండె కొట్టుకునే రేటు = 75.9 (నిమిషానికి)
5. In a retail market, fruit vendors were selling mangoes kept in packing boxes. These boxes contained varying number of mangoes. The following was the distribution of mangoes according to the number of boxes.
| Number of mangoes | Number of boxes |
|---|---|
| 50 – 52 | 15 |
| 53 – 55 | 110 |
| 56 – 58 | 135 |
| 59 – 61 | 115 |
| 62 – 64 | 25 |
Find the mean number of mangoes kept in a packing box. Which method of finding the mean did you choose?
జవాబు చూడండి
మధ్య బిందువులు 51, 54, 57, 60, 63; వరుస తేడా 3. పౌనఃపున్యాలు పెద్దవి కాబట్టి సోపాన విచలన పద్ధతి, a = 57, h = 3.
| తరగతి | fi | xi | ui = (xi − 57)/3 | fiui |
|---|---|---|---|---|
| 50 – 52 | 15 | 51 | −2 | −30 |
| 53 – 55 | 110 | 54 | −1 | −110 |
| 56 – 58 | 135 | 57 | 0 | 0 |
| 59 – 61 | 115 | 60 | 1 | 115 |
| 62 – 64 | 25 | 63 | 2 | 50 |
| మొత్తం | 400 | 25 |
x̄ = a + (Σfiui / Σfi) × h = 57 + (25/400) × 3 = 57.1875
ఒక పెట్టెలో సగటు మామిడి పండ్లు = 57.1875 ≈ 57.19
పద్ధతి: సోపాన విచలన పద్ధతి. fi పెద్ద సంఖ్యలు కావడంతో fixi గుణకారాలు పెద్దవి అవుతాయి; ui తో అవి చిన్నవి.
6. The table below shows the daily expenditure on food of 25 households in a locality.
| Daily expenditure (in Rs) | Number of households |
|---|---|
| 100 – 150 | 4 |
| 150 – 200 | 5 |
| 200 – 250 | 12 |
| 250 – 300 | 2 |
| 300 – 350 | 2 |
Find the mean daily expenditure on food by a suitable method.
జవాబు చూడండి
h = 50, a = 225 తీసుకుని సోపాన విచలన పద్ధతి.
| తరగతి | fi | xi | ui = (xi − 225)/50 | fiui |
|---|---|---|---|---|
| 100 – 150 | 4 | 125 | −2 | −8 |
| 150 – 200 | 5 | 175 | −1 | −5 |
| 200 – 250 | 12 | 225 | 0 | 0 |
| 250 – 300 | 2 | 275 | 1 | 2 |
| 300 – 350 | 2 | 325 | 2 | 4 |
| మొత్తం | 25 | −7 |
x̄ = a + (Σfiui / Σfi) × h = 225 + (−7/25) × 50 = 211
సగటు రోజువారీ ఆహార ఖర్చు = Rs 211
7. To find out the concentration of SO2 in the air (in parts per million, i.e., ppm), the data was collected for 30 localities in a certain city and is presented below:
| Concentration of SO2 (in ppm) | Frequency |
|---|---|
| 0.00 – 0.04 | 4 |
| 0.04 – 0.08 | 9 |
| 0.08 – 0.12 | 9 |
| 0.12 – 0.16 | 2 |
| 0.16 – 0.20 | 4 |
| 0.20 – 0.24 | 2 |
Find the mean concentration of SO2 in the air.
జవాబు చూడండి
దశాంశాలు చిన్నవి కాబట్టి ప్రత్యక్ష పద్ధతి.
| తరగతి | fi | xi | fixi |
|---|---|---|---|
| 0.00 – 0.04 | 4 | 0.02 | 0.08 |
| 0.04 – 0.08 | 9 | 0.06 | 0.54 |
| 0.08 – 0.12 | 9 | 0.1 | 0.9 |
| 0.12 – 0.16 | 2 | 0.14 | 0.28 |
| 0.16 – 0.20 | 4 | 0.18 | 0.72 |
| 0.20 – 0.24 | 2 | 0.22 | 0.44 |
| మొత్తం | 30 | 2.96 |
x̄ = Σfixi / Σfi = 2.96 / 30 = 0.0987
సగటు SO2 సాంద్రత ≈ 0.099 ppm
8. A class teacher has the following absentee record of 40 students of a class for the whole term. Find the mean number of days a student was absent.
| Number of days | Number of students |
|---|---|
| 0 – 6 | 11 |
| 6 – 10 | 10 |
| 10 – 14 | 7 |
| 14 – 20 | 4 |
| 20 – 28 | 4 |
| 28 – 38 | 3 |
| 38 – 40 | 1 |
జవాబు చూడండి
ఇక్కడ తరగతుల పొడవులు సమానం కావు (6, 4, 4, 6, 8, 10, 2), కాబట్టి సోపాన విచలన పద్ధతి కుదరదు; ప్రత్యక్ష పద్ధతి వాడాం.
| తరగతి | fi | xi | fixi |
|---|---|---|---|
| 0 – 6 | 11 | 3 | 33 |
| 6 – 10 | 10 | 8 | 80 |
| 10 – 14 | 7 | 12 | 84 |
| 14 – 20 | 4 | 17 | 68 |
| 20 – 28 | 4 | 24 | 96 |
| 28 – 38 | 3 | 33 | 99 |
| 38 – 40 | 1 | 39 | 39 |
| మొత్తం | 40 | 499 |
x̄ = Σfixi / Σfi = 499 / 40 = 12.475
ఒక విద్యార్థి సగటున గైర్హాజరైన రోజులు = 12.475 ≈ 12.48 రోజులు
9. The following table gives the literacy rate (in percentage) of 35 cities. Find the mean literacy rate.
| Literacy rate (in %) | Number of cities |
|---|---|
| 45 – 55 | 3 |
| 55 – 65 | 10 |
| 65 – 75 | 11 |
| 75 – 85 | 8 |
| 85 – 95 | 3 |
జవాబు చూడండి
h = 10, a = 70 తో సోపాన విచలన పద్ధతి.
| తరగతి | fi | xi | ui = (xi − 70)/10 | fiui |
|---|---|---|---|---|
| 45 – 55 | 3 | 50 | −2 | −6 |
| 55 – 65 | 10 | 60 | −1 | −10 |
| 65 – 75 | 11 | 70 | 0 | 0 |
| 75 – 85 | 8 | 80 | 1 | 8 |
| 85 – 95 | 3 | 90 | 2 | 6 |
| మొత్తం | 35 | −2 |
x̄ = a + (Σfiui / Σfi) × h = 70 + (−2/35) × 10 = 69.4286
సగటు అక్షరాస్యత రేటు ≈ 69.43%
AP 10th Class Maths Statistics Exercise 13.2 Solutions (Mode)
ముందు బాహుళక తరగతి (ఎక్కువ పౌనఃపున్యం ఉన్న తరగతి) గుర్తించండి. తర్వాత దాని ముందు, వెనుక తరగతుల పౌనఃపున్యాలు f0, f2 తీసుకోండి.
1. The following table shows the ages of the patients admitted in a hospital during a year:
| Age (in years) | No. of patients |
|---|---|
| 5 – 15 | 6 |
| 15 – 25 | 11 |
| 25 – 35 | 21 |
| 35 – 45 | 23 |
| 45 – 55 | 14 |
| 55 – 65 | 5 |
Find the mode and the mean of the data given above. Compare and interpret the two measures of central tendency.
జవాబు చూడండి
బాహుళకం: బాహుళక తరగతి (ఎక్కువ పౌనఃపున్యం 23) = 35 – 45. l = 35, h = 10, f1 = 23, f0 = 21, f2 = 14
బాహుళకం = l + [(f1 − f0) / (2f1 − f0 − f2)] × h = 35 + [2 / 11] × 10 = 36.8182 ≈ 36.8 సంవత్సరాలు
సగటు:
| తరగతి | fi | xi | fixi |
|---|---|---|---|
| 5 – 15 | 6 | 10 | 60 |
| 15 – 25 | 11 | 20 | 220 |
| 25 – 35 | 21 | 30 | 630 |
| 35 – 45 | 23 | 40 | 920 |
| 45 – 55 | 14 | 50 | 700 |
| 55 – 65 | 5 | 60 | 300 |
| మొత్తం | 80 | 2830 |
x̄ = Σfixi / Σfi = 2830 / 80 = 35.375 సంవత్సరాలు (పుస్తకం జవాబు 35.37)
పోలిక: ఆసుపత్రిలో చేరినవారిలో ఎక్కువ మంది వయసు సుమారు 36.8 సంవత్సరాలు; సగటున ఒక రోగి వయసు సుమారు 35.37 సంవత్సరాలు.
2. The following data gives the information on the observed lifetimes (in hours) of 225 electrical components :
| Lifetimes (in hours) | Frequency |
|---|---|
| 0 – 20 | 10 |
| 20 – 40 | 35 |
| 40 – 60 | 52 |
| 60 – 80 | 61 |
| 80 – 100 | 38 |
| 100 – 120 | 29 |
Determine the modal lifetimes of the components.
జవాబు చూడండి
బాహుళకం = l + [(f1 − f0) / (2f1 − f0 − f2)] × h = 60 + [9 / 32] × 20 = 65.625
బాహుళక జీవితకాలం = 65.625 గంటలు
3. The following data gives the distribution of total monthly household expenditure of 200 families of a village. Find the modal monthly expenditure of the families. Also, find the mean monthly expenditure :
| Expenditure (in Rs) | Number of families |
|---|---|
| 1000 – 1500 | 24 |
| 1500 – 2000 | 40 |
| 2000 – 2500 | 33 |
| 2500 – 3000 | 28 |
| 3000 – 3500 | 30 |
| 3500 – 4000 | 22 |
| 4000 – 4500 | 16 |
| 4500 – 5000 | 7 |
జవాబు చూడండి
బాహుళకం: బాహుళక తరగతి (ఎక్కువ పౌనఃపున్యం 40) = 1500 – 2000. l = 1500, h = 500, f1 = 40, f0 = 24, f2 = 33
బాహుళకం = l + [(f1 − f0) / (2f1 − f0 − f2)] × h = 1500 + [16 / 23] × 500 = 1847.8261 ≈ Rs 1847.83
సగటు (సోపాన విచలన పద్ధతి, a = 3250, h = 500):
| తరగతి | fi | xi | ui = (xi − 3250)/500 | fiui |
|---|---|---|---|---|
| 1000 – 1500 | 24 | 1250 | −4 | −96 |
| 1500 – 2000 | 40 | 1750 | −3 | −120 |
| 2000 – 2500 | 33 | 2250 | −2 | −66 |
| 2500 – 3000 | 28 | 2750 | −1 | −28 |
| 3000 – 3500 | 30 | 3250 | 0 | 0 |
| 3500 – 4000 | 22 | 3750 | 1 | 22 |
| 4000 – 4500 | 16 | 4250 | 2 | 32 |
| 4500 – 5000 | 7 | 4750 | 3 | 21 |
| మొత్తం | 200 | −235 |
x̄ = a + (Σfiui / Σfi) × h = 3250 + (−235/200) × 500 = 2662.5
సగటు నెలవారీ ఖర్చు = Rs 2662.5
4. The following distribution gives the state-wise teacher-student ratio in higher secondary schools of India. Find the mode and mean of this data. Interpret the two measures.
| Number of students per teacher | Number of states / U.T. |
|---|---|
| 15 – 20 | 3 |
| 20 – 25 | 8 |
| 25 – 30 | 9 |
| 30 – 35 | 10 |
| 35 – 40 | 3 |
| 40 – 45 | 0 |
| 45 – 50 | 0 |
| 50 – 55 | 2 |
జవాబు చూడండి
బాహుళకం: బాహుళక తరగతి (ఎక్కువ పౌనఃపున్యం 10) = 30 – 35. l = 30, h = 5, f1 = 10, f0 = 9, f2 = 3
బాహుళకం = l + [(f1 − f0) / (2f1 − f0 − f2)] × h = 30 + [1 / 8] × 5 = 30.625 ≈ 30.6
సగటు (a = 32.5, h = 5):
| తరగతి | fi | xi | ui = (xi − 32.5)/5 | fiui |
|---|---|---|---|---|
| 15 – 20 | 3 | 17.5 | −3 | −9 |
| 20 – 25 | 8 | 22.5 | −2 | −16 |
| 25 – 30 | 9 | 27.5 | −1 | −9 |
| 30 – 35 | 10 | 32.5 | 0 | 0 |
| 35 – 40 | 3 | 37.5 | 1 | 3 |
| 40 – 45 | 0 | 42.5 | 2 | 0 |
| 45 – 50 | 0 | 47.5 | 3 | 0 |
| 50 – 55 | 2 | 52.5 | 4 | 8 |
| మొత్తం | 35 | −23 |
x̄ = a + (Σfiui / Σfi) × h = 32.5 + (−23/35) × 5 = 29.2143 ≈ 29.2
అర్థం: ఎక్కువ రాష్ట్రాలు/కేంద్రపాలిత ప్రాంతాల్లో ఒక ఉపాధ్యాయునికి సుమారు 30.6 మంది విద్యార్థులు; సగటున ఈ నిష్పత్తి 29.2.
5. The given distribution shows the number of runs scored by some top batsmen of the world in one-day international cricket matches.
| Runs scored | Number of batsmen |
|---|---|
| 3000 – 4000 | 4 |
| 4000 – 5000 | 18 |
| 5000 – 6000 | 9 |
| 6000 – 7000 | 7 |
| 7000 – 8000 | 6 |
| 8000 – 9000 | 3 |
| 9000 – 10000 | 1 |
| 10000 – 11000 | 1 |
Find the mode of the data.
జవాబు చూడండి
బాహుళకం = l + [(f1 − f0) / (2f1 − f0 − f2)] × h = 4000 + [14 / 23] × 1000 = 4608.6957
బాహుళకం ≈ 4608.7 పరుగులు
6. A student noted the number of cars passing through a spot on a road for 100 periods each of 3 minutes and summarised it in the table given below. Find the mode of the data :
| No. of cars | Frequency |
|---|---|
| 0 – 10 | 7 |
| 10 – 20 | 14 |
| 20 – 30 | 13 |
| 30 – 40 | 12 |
| 40 – 50 | 20 |
| 50 – 60 | 11 |
| 60 – 70 | 15 |
| 70 – 80 | 8 |
జవాబు చూడండి
బాహుళకం = l + [(f1 − f0) / (2f1 − f0 − f2)] × h = 40 + [8 / 17] × 10 = 44.7059
బాహుళకం ≈ 44.7 కార్లు
AP 10th Class Maths Statistics Exercise 13.3 Solutions (Median)
ముందు సంచిత పౌనఃపున్యం (cf) పట్టిక వేయండి. n/2 కంటే cf మొదట ఎక్కువయ్యే తరగతే మధ్యగత తరగతి.
1. The following frequency distribution gives the monthly consumption of electricity of 68 consumers of a locality. Find the median, mean and mode of the data and compare them.
| Monthly consumption (in units) | Number of consumers |
|---|---|
| 65 – 85 | 4 |
| 85 – 105 | 5 |
| 105 – 125 | 13 |
| 125 – 145 | 20 |
| 145 – 165 | 14 |
| 165 – 185 | 8 |
| 185 – 205 | 4 |
జవాబు చూడండి
మధ్యగతం:
| తరగతి | f | cf |
|---|---|---|
| 65 – 85 | 4 | 4 |
| 85 – 105 | 5 | 9 |
| 105 – 125 | 13 | 22 |
| 125 – 145 | 20 | 42 |
| 145 – 165 | 14 | 56 |
| 165 – 185 | 8 | 64 |
| 185 – 205 | 4 | 68 |
n = 68, n/2 = 34. cf 34 ను మొదట దాటే తరగతి 125 – 145 మధ్యగత తరగతి. l = 125, cf = 22, f = 20, h = 20
మధ్యగతం = l + [(n/2 − cf) / f] × h = 125 + [(34 − 22) / 20] × 20 = 137 units
సగటు (a = 135, h = 20):
| తరగతి | fi | xi | ui = (xi − 135)/20 | fiui |
|---|---|---|---|---|
| 65 – 85 | 4 | 75 | −3 | −12 |
| 85 – 105 | 5 | 95 | −2 | −10 |
| 105 – 125 | 13 | 115 | −1 | −13 |
| 125 – 145 | 20 | 135 | 0 | 0 |
| 145 – 165 | 14 | 155 | 1 | 14 |
| 165 – 185 | 8 | 175 | 2 | 16 |
| 185 – 205 | 4 | 195 | 3 | 12 |
| మొత్తం | 68 | 7 |
x̄ = a + (Σfiui / Σfi) × h = 135 + (7/68) × 20 = 137.0588 units (పుస్తకం జవాబు 137.05)
బాహుళకం: బాహుళక తరగతి (ఎక్కువ పౌనఃపున్యం 20) = 125 – 145. l = 125, h = 20, f1 = 20, f0 = 13, f2 = 14
బాహుళకం = l + [(f1 − f0) / (2f1 − f0 − f2)] × h = 125 + [7 / 13] × 20 = 135.7692 units (పుస్తకం జవాబు 135.76)
పోలిక: మధ్యగతం 137, సగటు 137.05, బాహుళకం 135.76 — మూడూ దాదాపు సమానం.
2. If the median of the distribution given below is 28.5, find the values of x and y.
| Class interval | Frequency |
|---|---|
| 0 – 10 | 5 |
| 10 – 20 | x |
| 20 – 30 | 20 |
| 30 – 40 | 15 |
| 40 – 50 | y |
| 50 – 60 | 5 |
| Total | 60 |
జవాబు చూడండి
మొత్తం: 5 + x + 20 + 15 + y + 5 = 60 ⇒ x + y = 15
| తరగతి | f | cf |
|---|---|---|
| 0 – 10 | 5 | 5 |
| 10 – 20 | x | 5 + x |
| 20 – 30 | 20 | 25 + x |
| 30 – 40 | 15 | 40 + x |
| 40 – 50 | y | 40 + x + y |
| 50 – 60 | 5 | 45 + x + y |
మధ్యగతం 28.5 కాబట్టి మధ్యగత తరగతి 20 – 30: l = 20, h = 10, f = 20, cf = 5 + x, n/2 = 30
28.5 = 20 + [(30 − 5 − x)/20] × 10 ⇒ 8.5 = (25 − x)/2 ⇒ 25 − x = 17 ⇒ x = 8
y = 15 − 8 = 7. కాబట్టి x = 8, y = 7
3. A life insurance agent found the following data for distribution of ages of 100 policy holders. Calculate the median age, if policies are given only to persons having age 18 years onwards but less than 60 year.
| Age (in years) | Number of policy holders |
|---|---|
| Below 20 | 2 |
| Below 25 | 6 |
| Below 30 | 24 |
| Below 35 | 45 |
| Below 40 | 78 |
| Below 45 | 89 |
| Below 50 | 92 |
| Below 55 | 98 |
| Below 60 | 100 |
జవాబు చూడండి
ఇచ్చింది “కంటే తక్కువ” సంచిత పౌనఃపున్యం. వరుస తేడాలు తీస్తే ప్రతి తరగతి పౌనఃపున్యం వస్తుంది (ఉదా: 25 – 30 కి 24 − 6 = 18).
| తరగతి | f | cf |
|---|---|---|
| 18 – 20 (Below 20) | 2 | 2 |
| 20 – 25 | 4 | 6 |
| 25 – 30 | 18 | 24 |
| 30 – 35 | 21 | 45 |
| 35 – 40 | 33 | 78 |
| 40 – 45 | 11 | 89 |
| 45 – 50 | 3 | 92 |
| 50 – 55 | 6 | 98 |
| 55 – 60 | 2 | 100 |
n = 100, n/2 = 50. cf 50 ను మొదట దాటే తరగతి 35 – 40 మధ్యగత తరగతి. l = 35, cf = 45, f = 33, h = 5
మధ్యగతం = l + [(n/2 − cf) / f] × h = 35 + [(50 − 45) / 33] × 5 = 35.7576
మధ్యగత వయసు ≈ 35.76 సంవత్సరాలు
గమనిక: మొదటి తరగతి 18 నుంచి మొదలైనా మధ్యగత తరగతి 35 – 40 కాబట్టి జవాబు మారదు.
4. The lengths of 40 leaves of a plant are measured correct to the nearest millimetre, and the data obtained is represented in the following table :
| Length (in mm) | Number of leaves |
|---|---|
| 118 – 126 | 3 |
| 127 – 135 | 5 |
| 136 – 144 | 9 |
| 145 – 153 | 12 |
| 154 – 162 | 5 |
| 163 – 171 | 4 |
| 172 – 180 | 2 |
Find the median length of the leaves.
(Hint : The data needs to be converted to continuous classes for finding the median, since the formula assumes continuous classes. The classes then change to 117.5 – 126.5, 126.5 – 135.5, . . ., 171.5 – 180.5.)
జవాబు చూడండి
తరగతుల మధ్య ఖాళీ 1 కాబట్టి ప్రతి దిగువ హద్దు నుంచి 0.5 తీసి, ఎగువ హద్దుకు 0.5 కలిపి నిరంతర తరగతులుగా మార్చాం.
| తరగతి | f | cf |
|---|---|---|
| 117.5 – 126.5 | 3 | 3 |
| 126.5 – 135.5 | 5 | 8 |
| 135.5 – 144.5 | 9 | 17 |
| 144.5 – 153.5 | 12 | 29 |
| 153.5 – 162.5 | 5 | 34 |
| 162.5 – 171.5 | 4 | 38 |
| 171.5 – 180.5 | 2 | 40 |
n = 40, n/2 = 20. cf 20 ను మొదట దాటే తరగతి 144.5 – 153.5 మధ్యగత తరగతి. l = 144.5, cf = 17, f = 12, h = 9
మధ్యగతం = l + [(n/2 − cf) / f] × h = 144.5 + [(20 − 17) / 12] × 9 = 146.75
ఆకుల మధ్యగత పొడవు = 146.75 mm
5. The following table gives the distribution of the life time of 400 neon lamps :
| Life time (in hours) | Number of lamps |
|---|---|
| 1500 – 2000 | 14 |
| 2000 – 2500 | 56 |
| 2500 – 3000 | 60 |
| 3000 – 3500 | 86 |
| 3500 – 4000 | 74 |
| 4000 – 4500 | 62 |
| 4500 – 5000 | 48 |
Find the median life time of a lamp.
జవాబు చూడండి
| తరగతి | f | cf |
|---|---|---|
| 1500 – 2000 | 14 | 14 |
| 2000 – 2500 | 56 | 70 |
| 2500 – 3000 | 60 | 130 |
| 3000 – 3500 | 86 | 216 |
| 3500 – 4000 | 74 | 290 |
| 4000 – 4500 | 62 | 352 |
| 4500 – 5000 | 48 | 400 |
n = 400, n/2 = 200. cf 200 ను మొదట దాటే తరగతి 3000 – 3500 మధ్యగత తరగతి. l = 3000, cf = 130, f = 86, h = 500
మధ్యగతం = l + [(n/2 − cf) / f] × h = 3000 + [(200 − 130) / 86] × 500 = 3406.9767
మధ్యగత జీవితకాలం ≈ 3406.98 గంటలు
6. 100 surnames were randomly picked up from a local telephone directory and the frequency distribution of the number of letters in the English alphabets in the surnames was obtained as follows:
| Number of letters | Number of surnames |
|---|---|
| 1 – 4 | 6 |
| 4 – 7 | 30 |
| 7 – 10 | 40 |
| 10 – 13 | 16 |
| 13 – 16 | 4 |
| 16 – 19 | 4 |
Determine the median number of letters in the surnames. Find the mean number of letters in the surnames? Also, find the modal size of the surnames.
జవాబు చూడండి
మధ్యగతం:
| తరగతి | f | cf |
|---|---|---|
| 1 – 4 | 6 | 6 |
| 4 – 7 | 30 | 36 |
| 7 – 10 | 40 | 76 |
| 10 – 13 | 16 | 92 |
| 13 – 16 | 4 | 96 |
| 16 – 19 | 4 | 100 |
n = 100, n/2 = 50. cf 50 ను మొదట దాటే తరగతి 7 – 10 మధ్యగత తరగతి. l = 7, cf = 36, f = 40, h = 3
మధ్యగతం = l + [(n/2 − cf) / f] × h = 7 + [(50 − 36) / 40] × 3 = 8.05
సగటు:
| తరగతి | fi | xi | fixi |
|---|---|---|---|
| 1 – 4 | 6 | 2.5 | 15 |
| 4 – 7 | 30 | 5.5 | 165 |
| 7 – 10 | 40 | 8.5 | 340 |
| 10 – 13 | 16 | 11.5 | 184 |
| 13 – 16 | 4 | 14.5 | 58 |
| 16 – 19 | 4 | 17.5 | 70 |
| మొత్తం | 100 | 832 |
x̄ = Σfixi / Σfi = 832 / 100 = 8.32
బాహుళకం: బాహుళక తరగతి (ఎక్కువ పౌనఃపున్యం 40) = 7 – 10. l = 7, h = 3, f1 = 40, f0 = 30, f2 = 16
బాహుళకం = l + [(f1 − f0) / (2f1 − f0 − f2)] × h = 7 + [10 / 34] × 3 = 7.8824 ≈ 7.88
మధ్యగతం = 8.05, సగటు = 8.32, బాహుళకం = 7.88
7. The distribution below gives the weights of 30 students of a class. Find the median weight of the students.
| Weight (in kg) | No. of students |
|---|---|
| 40 – 45 | 2 |
| 45 – 50 | 3 |
| 50 – 55 | 8 |
| 55 – 60 | 6 |
| 60 – 65 | 6 |
| 65 – 70 | 3 |
| 70 – 75 | 2 |
జవాబు చూడండి
| తరగతి | f | cf |
|---|---|---|
| 40 – 45 | 2 | 2 |
| 45 – 50 | 3 | 5 |
| 50 – 55 | 8 | 13 |
| 55 – 60 | 6 | 19 |
| 60 – 65 | 6 | 25 |
| 65 – 70 | 3 | 28 |
| 70 – 75 | 2 | 30 |
n = 30, n/2 = 15. cf 15 ను మొదట దాటే తరగతి 55 – 60 మధ్యగత తరగతి. l = 55, cf = 13, f = 6, h = 5
మధ్యగతం = l + [(n/2 − cf) / f] × h = 55 + [(15 − 13) / 6] × 5 = 56.6667
మధ్యగత బరువు ≈ 56.67 kg
Statistics లెక్కల్లో మార్కులు ఎక్కడ పోతాయి
- పట్టిక వేయకపోవడం: జవాబు ఒక్కటే రాస్తే సరిపోదు. xi, fixi (లేదా ui, fiui), cf నిలువు వరుసలతో పట్టిక వేసి, మొత్తాలు రాయండి.
- మధ్య బిందువు తప్పు: xi = (దిగువ హద్దు + ఎగువ హద్దు)/2. 65 – 68 కి 66.5, 66 కాదు.
- f0, f2 తారుమారు: f0 ఎప్పుడూ బాహుళక తరగతికి ముందు తరగతిది, f2 తర్వాత తరగతిది.
- మధ్యగతంలో cf: సూత్రంలోని cf మధ్యగత తరగతిది కాదు, దానికి ముందు తరగతి వరకు ఉన్న సంచిత పౌనఃపున్యం.
- నిరంతరం కాని తరగతులు: 118 – 126, 127 – 135 లాంటివి ఉంటే బాహుళకం, మధ్యగతం ముందు 117.5 – 126.5 గా మార్చాలి.
- రుణ గుర్తులు: ui, di లో − గుర్తులు ఉంటాయి; Σfiui కూడేటప్పుడు గుర్తులు జాగ్రత్తగా చూడండి.
మిగతా అధ్యాయాల జవాబులు AP 10th Class Maths Solutions హబ్లో, అధ్యాయాల వారీ నోట్స్ AP 10th Class Maths Study Material PDF లో ఉన్నాయి. ఇదే SA1 కోసం AP 10th Class Maths Coordinate Geometry Solutions కూడా చూడండి. మిగతా అధ్యాయాల ముఖ్యమైన ప్రశ్నలు 10th Class Maths Important Questions with Answers లో ఉన్నాయి.
తర్వాత ఏం చదవాలి
- AP 10th Class SA1 Maths Question Paper 2026-27 — సగటు, బాహుళకం, మధ్యగతం ప్రశ్నలతో SA1 నమూనా పేపర్
- Introduction to Trigonometry Solutions — అక్టోబర్లో కొత్తగా చేరిన అధ్యాయం, Exercise 8.1, 8.2, 8.3
- Some Applications of Trigonometry Solutions — ఎత్తులు, దూరాల 15 లెక్కలు
తర్వాతి అధ్యాయం AP 10th Class Maths Probability Solutions లో Exercise 14.1 లోని 25 ప్రశ్నల జవాబులు ఉన్నాయి.
FAQs
Statistics అధ్యాయంలో ఎన్ని ఎక్సర్సైజ్లు, ఎన్ని ప్రశ్నలు?
AP SCERT Semester 2 పుస్తకంలో మూడు: Exercise 13.1 (9), 13.2 (6), 13.3 (7). మొత్తం 22 ప్రశ్నలు, అన్నింటి జవాబులు ఈ పేజీలో ఉన్నాయి.
Statistics SA1 లో వస్తుందా?
అవును. 10వ తరగతి SA1 గణితం సిలబస్లో Statistics ఉంది.
సగటుకు మూడు పద్ధతుల్లో ఏది వాడాలి?
ఏదైనా వాడవచ్చు, జవాబు ఒకటే. విలువలు చిన్నవైతే ప్రత్యక్ష పద్ధతి, తరగతి పొడవు సమానమై విలువలు పెద్దవైతే సోపాన విచలన పద్ధతి సులువు. ప్రశ్నలో పద్ధతి పేరు ఇస్తే అదే వాడాలి.
తరగతి మధ్య బిందువు (class mark) ఎలా కనుగొనాలి?
(దిగువ హద్దు + ఎగువ హద్దు)/2. ఉదాహరణకు 500 – 520 కి 510.
బాహుళక తరగతి అంటే ఏమిటి?
ఎక్కువ పౌనఃపున్యం ఉన్న తరగతి. బాహుళకం సూత్రంలోని l, f1 ఈ తరగతివి.
మధ్యగత తరగతిని ఎలా గుర్తించాలి?
n/2 లెక్కించి, సంచిత పౌనఃపున్యం (cf) మొదటిసారి n/2 ని చేరే లేదా దాటే తరగతిని తీసుకోండి.
13.1 ప్రశ్న 3 లో f విలువ ఎంత?
f = 20. సగటు 18 ఇచ్చారు కాబట్టి a = 18 తీసుకుంటే Σfidi = 0 అవ్వాలి; 2f − 40 = 0 నుంచి f = 20.
13.3 ప్రశ్న 2 లో x, y విలువలు?
x = 8, y = 7. మొత్తం 60 నుంచి x + y = 15; మధ్యగతం 28.5 సూత్రంలో వేస్తే x = 8.
తరగతుల మధ్య ఖాళీ ఉంటే ఏం చేయాలి?
తరగతులను నిరంతరంగా మార్చాలి. రెండు తరగతుల మధ్య ఖాళీ 1 అయితే దిగువ హద్దు నుంచి 0.5 తీసి, ఎగువ హద్దుకు 0.5 కలపండి (13.3 ప్రశ్న 4).
“Below 20, Below 25” లాంటి పట్టిక ఇస్తే?
అది “కంటే తక్కువ” సంచిత పౌనఃపున్య పట్టిక. వరుసగా తీసివేస్తే ప్రతి తరగతి పౌనఃపున్యం వస్తుంది (13.3 ప్రశ్న 3).
మీ జవాబు పుస్తకం జవాబుకు కొంచెం తేడాగా ఉంటే?
రెండో దశాంశ స్థానంలో తేడా సాధారణంగా రౌండింగ్ వల్ల వస్తుంది. ఉదాహరణకు 13.3 ప్రశ్న 1 లో సగటు 137.0588; పుస్తకం 137.05 అని ఇచ్చింది. మీ పద్ధతి, పట్టిక సరిగ్గా ఉంటే సరిపోతుంది.
మూలం: AP SCERT 10వ తరగతి గణితం పాఠ్యపుస్తకం (Semester 2, అధ్యాయం 13, ANSWERS/HINTS). అధికారిక పాఠ్యపుస్తకాలు, పాఠశాల విద్యాశాఖ సమాచారం కోసం Commissionerate of School Education, Andhra Pradesh సైట్ చూడండి.